


Op-Ed: Tackling the Disparity in Public School Funding

Photo purchased from BigStock.com.
January 7, 2020
Not only is Massachusetts home to some of the world’s most prestigious colleges and universities—Harvard, MIT, Tufts, Boston College, and more—but is it also known for having high-quality public schools.
According to Forbes, “Massachusetts ranked as the No. 1 state for public schools, taking the lead in both quality and safety.”
A comprehensive study by WalletHub also cites Massachusetts as first in the nation for math and reading scores, along with high ACT scores.
Nationwide, according to the United States Census Bureau, Massachusetts boasts the eighth highest cost per student ($15,593).
This shows a clear correlation between education spending and learning outcomes, but within Massachusetts, when it comes to public schools, how do prosperous cities and towns stack up against less wealthy ones?
First, it is important to understand how Massachusetts receives, distributes, and spends its money on education.
In Massachusetts, the majority of funding for schools comes from three main sources: the state, required local contributions, and extra local contributions. Each town has a unique funding formula, depending on size, wealth, and more.
First, the state determines the minimum spending per student statewide. According to the Massachusetts Budget and Policy Center (MassBudget), the department ensures that “spending in each district never falls below the amount needed to provide an adequate education to its students.”
Then the state determines the required local contribution from the town. MassBudget says that “the state calculates each city and town’s ability to contribute local revenue towards the operation of its schools. Local ability to contribute varies widely based upon the incomes and property values of different cities and towns.”
Following this, according to Chapter 70, the state program that “establishes minimum spending requirements for each school district and minimum requirements for each municipality’s share of school costs,”the state will provide funding to close the gap between the local contribution and the minimum spending per-student.
Lastly, the town is able to contribute extra money to its school system from local funding.
The Chapter 70 formula is a good way to fund public education. Towns are only required to pay what they can, and the state government will help close any gap in funding, which ensures that all students are getting an equal education. However, once the extra local funding is implemented, disparities in spending can arise between towns.
As seen in the graph below, the per-student funding is drastically different in some towns.
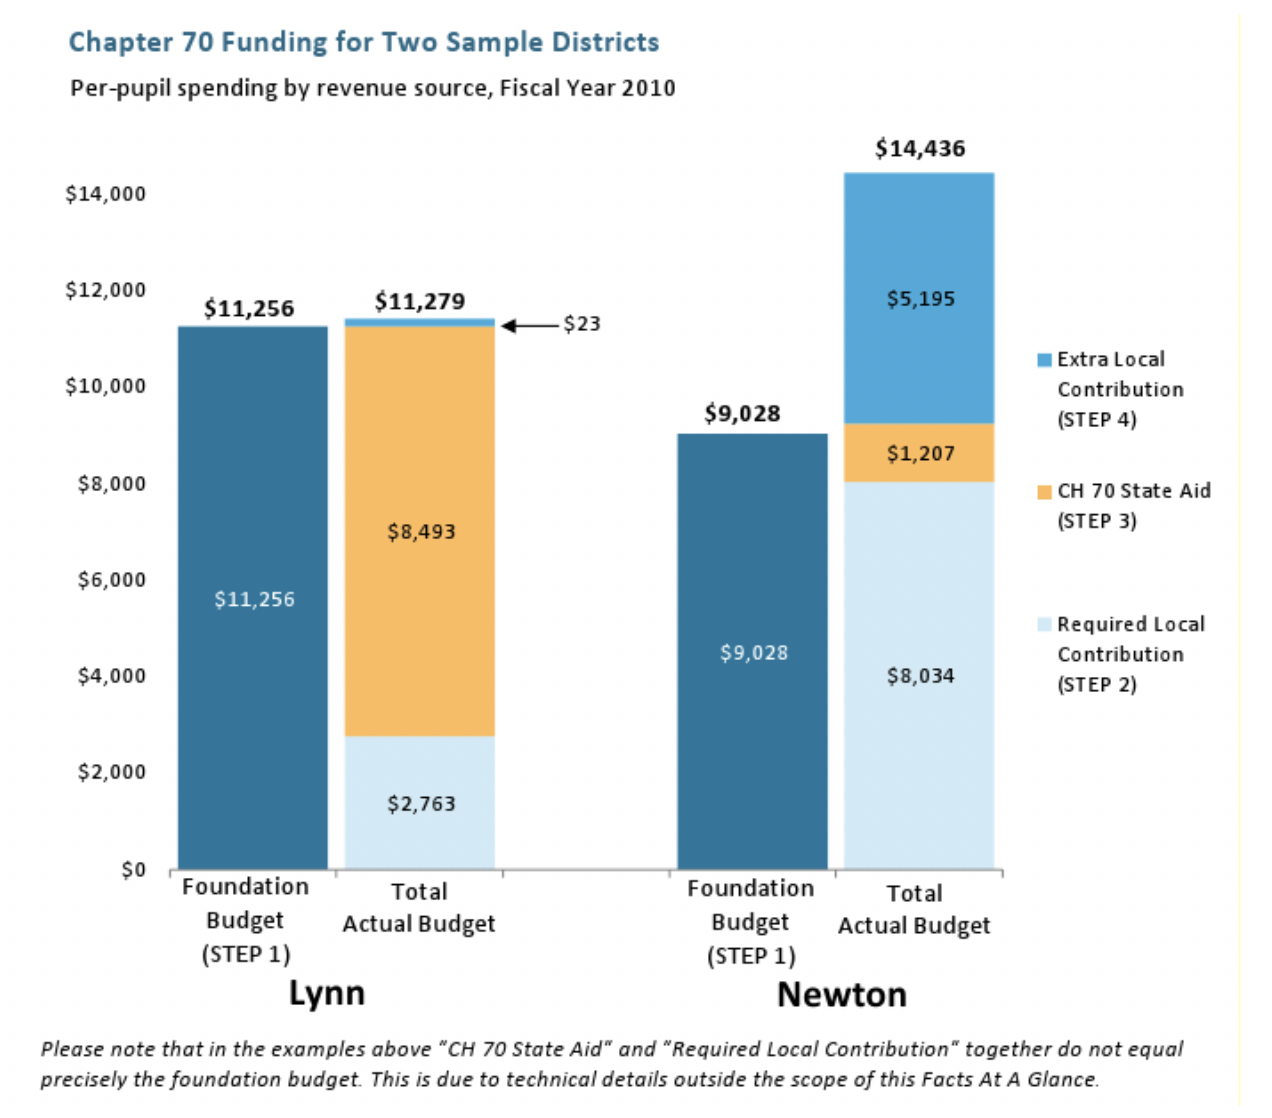
Lynn, a town on the North Shore, has an average household income of $44,849. By contrast, Newton, has an average household income of $119,148. This difference in income had a big effect on per-student spending, with Newton spending about 25% more per student in 2010. This is consistent with many of the other affluent towns in Massachusetts, with the top five richest towns spending about 30% more per student than the five poorest towns.
What does this mean for test scores and other aspects of student life, including athletics?
For standardized tests, there is a strong correlation between high per-student spending and high scores. The schools with the highest Massachusetts Comprehensive Assessment System (MCAS) scores are Hatfield, Harvard, Wayland, Dover-Sherborn, and Concord Carlisle. The average per-pupilspending for these schools is $18,000, which is 10% more than the average per-pupil spending in Massachusetts.
The lowest MCAS scores come from Southbridge, New Bedford, Holyoke, Springfield, and Chelsea. The average per-pupil spending for these schools is $16,500, $1,500 less than the aforementioned schools with high average test scores.
The effects of differences in wealth can also be seen in athletics. In the state, division 2 football consists of 11 schools. Of these 11 schools, the top five are Natick, Mansfield, Norfolk, New Bedford, and Wellesley. The average family income for these towns is $115,000. The bottom five schools are Braintree, Quincy, Durfee, Bridgewater, and Marshfield, where average family income is $86,000.
Massachusetts has a great education system, but disparities in school funding (most of which stem from extra local contributions), have a large impact on the educational and extracurricular success of students across the state. It’s time to change how funding is distributed to our state’s public schools. Hopefully, lawmakers are listening.